Valentine Treats Graph
Valentine's Day · Ages 3 to 6 · Free printable PDF
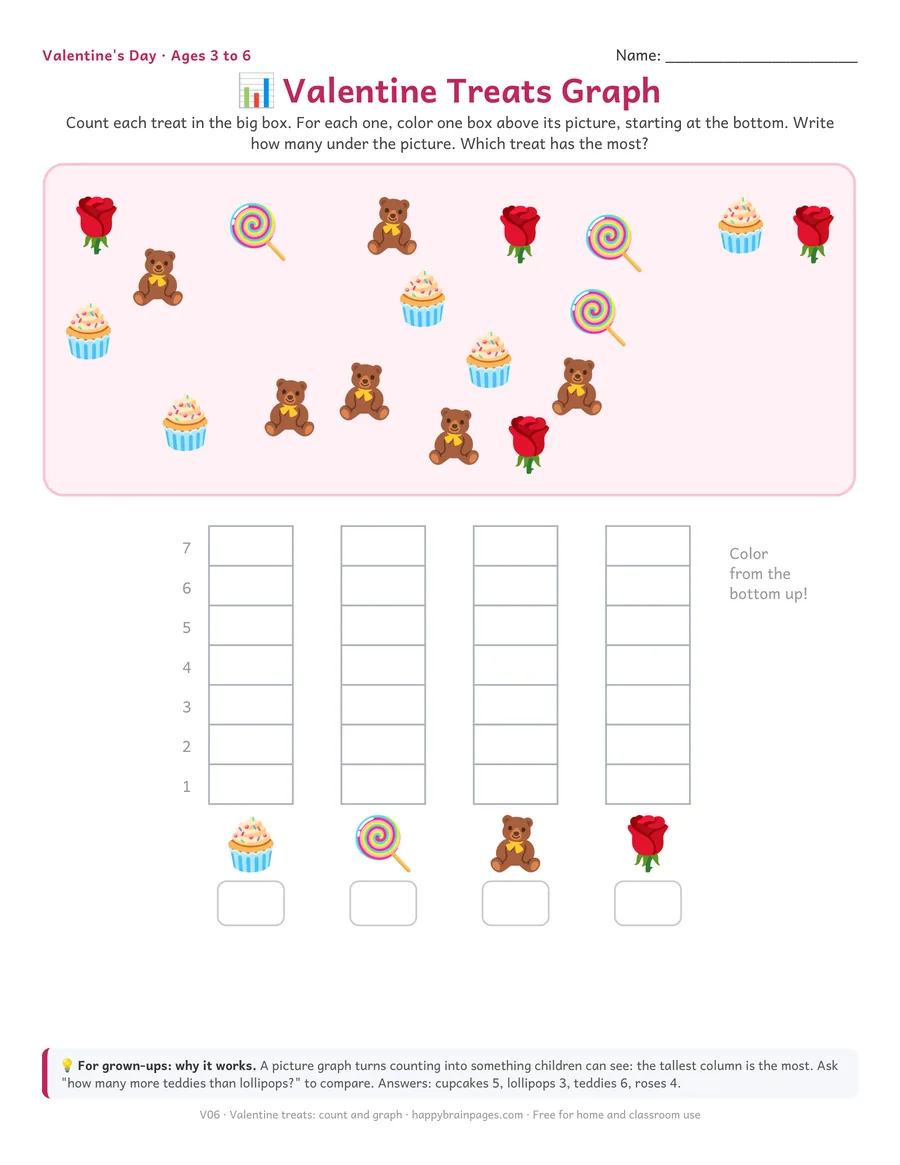
What your child does
Count each treat in the big box. For each one, color one box above its picture, starting at the bottom. Write how many under the picture. Which treat has the most?
 Color PDF
 Black and white PDF
Color: 230 KB · Black and white: 180 KB, with white backgrounds that save ink. US Letter. In the print window choose Actual size (or Scale 100%).
Why it works
A picture graph turns counting into something children can see: the tallest column is the most. Ask "how many more teddies than lollipops?" to compare. Answers: cupcakes 5, lollipops 3, teddies 6, roses 4.